
Usability Testing Score Calculator
Calculate usability scores easily with our free tool! Input task success, time, errors, and satisfaction to get a detailed score out of 100.
Unlock Better UX with a Usability Testing Score Calculator
If you're a UX researcher or designer, you know how tricky it can be to turn raw test data into actionable insights. That's where a tool to quantify usability metrics can make all the difference. By breaking down complex results into a single, easy-to-understand number, you can quickly spot strengths and weaknesses in your design.
Why Quantifying Usability Matters
Usability testing is the backbone of creating products that people love. But without a clear way to measure outcomes, you're often left guessing. A calculator for UX test results helps bridge that gap. It takes inputs like task completion rates, time spent, error counts, and user feedback, then transforms them into a meaningful score. This approach lets you compare iterations, justify design changes to stakeholders, and focus on what truly impacts the user experience.
Beyond Numbers: Real Impact
Numbers alone won't redesign your product, but they point you in the right direction. Whether you're refining an app or overhauling a website, having a reliable metric to gauge user-friendliness is invaluable. Use this kind of tool to streamline your workflow and build experiences that keep users coming back.
FAQs
How is the overall usability score calculated?
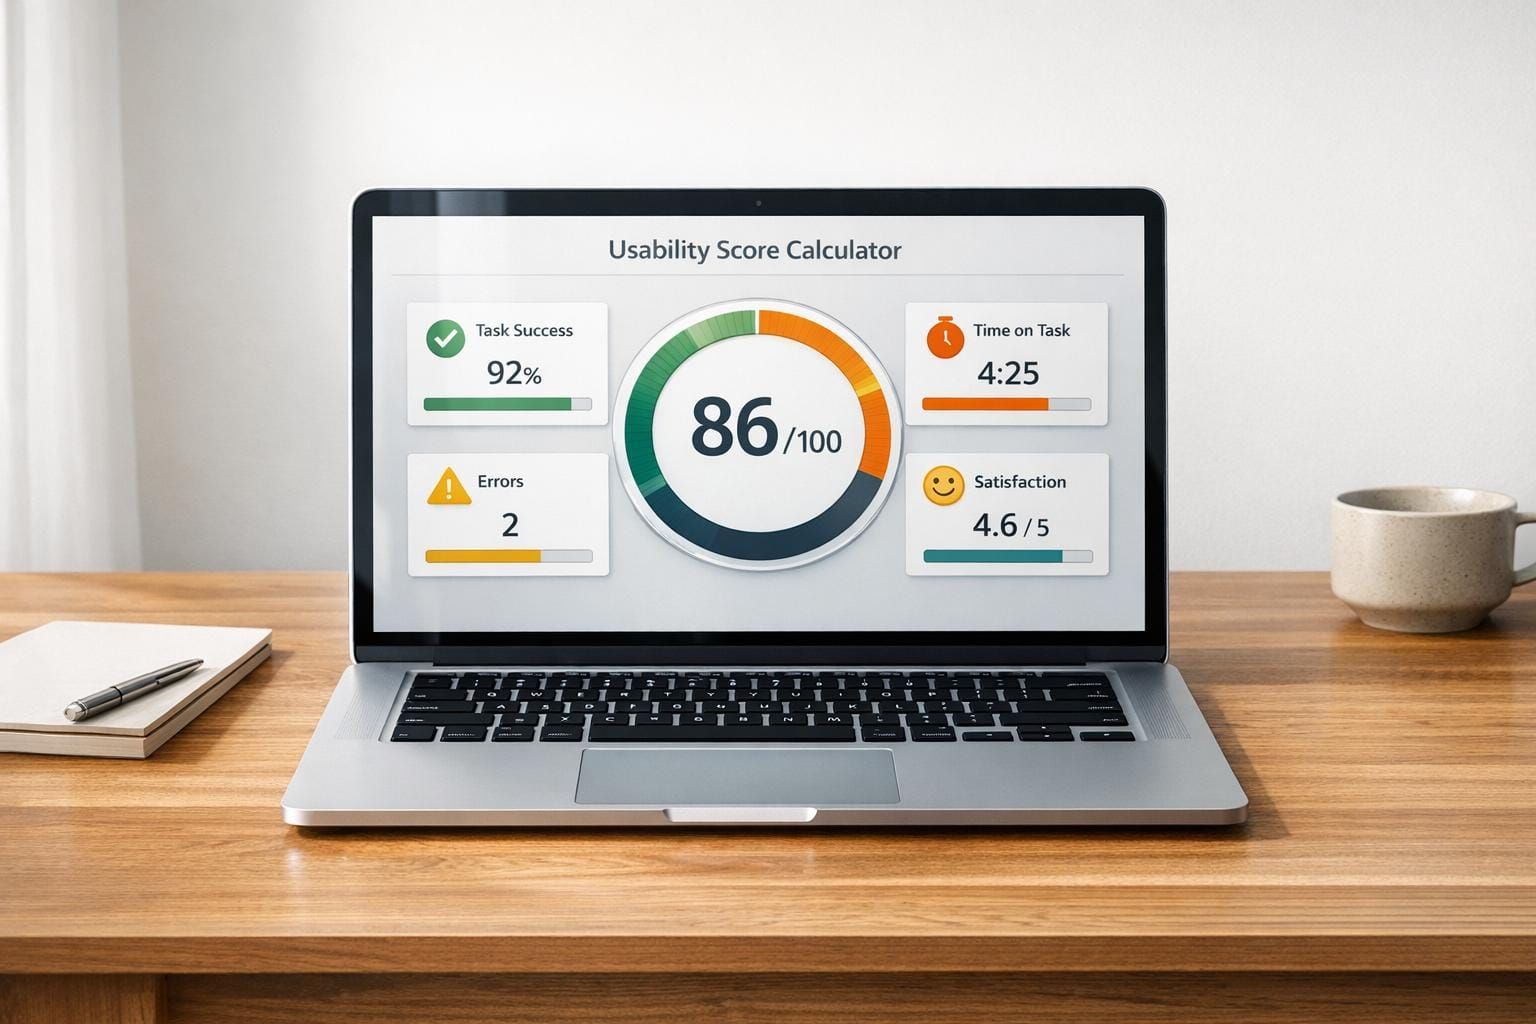
Great question! The score is a weighted average based on four metrics. Task Success Rate and User Satisfaction each contribute 30% to the final score, while Time on Task and Error Rate each make up 20%. We normalize the inputs—like converting time and errors into a comparable scale—then apply the weights to give you a total out of 100. This balance reflects the importance of both objective performance and subjective feedback in UX research.
Can I adjust the weight of each metric?
Not at the moment, and here’s why. We’ve set the weights—30% for Task Success and Satisfaction, 20% for Time on Task and Error Rate—based on common UX research standards to ensure a balanced evaluation. If you’re looking to tweak things, jot down the individual scores from the breakdown and adjust manually. We might consider customizable weights in a future update, so stay tuned!
What’s a 'good' usability score to aim for?
Honestly, it depends on your context, but I can give you a rough benchmark. Scores above 80 out of 100 generally indicate solid usability—your product is intuitive and user-friendly. Between 60 and 80? There’s room for improvement, so dig into the weaker metrics. Below 60 often means users are struggling, and you might need a redesign or deeper testing. Compare scores across iterations of your product to track progress over time.