
How API Monitoring Improves Scalable Interfaces
Catch slow requests, false-success responses, and retry cascades early by tracking p95/p99, error rates, uptime, traces and contract health.


If you can't see API failures early, your interface will fail in ways users feel first.
I’d sum it up like this: API monitoring helps me catch slow requests, bad dependencies, false-success responses, and ownership gaps before they turn into broken flows, support tickets, and long incident calls. It works best when I watch a small set of signals - uptime, error rate, throughput, p95/p99 latency, response correctness, retry behavior, and manual fixes - and connect them with logs, metrics, and traces.
Here’s the short version:
- Slow APIs hurt UX even when average response time looks fine
- One weak service can spread failure through retries and timeouts
- HTTP 200 with an error in the body can hide breakage from the UI
- Logs + traces + metrics cut time to find the cause
- Synthetic checks and contract validation help stop repeat incidents
- User-impact alerts matter more than noisy alerts
A few facts stand out: teams often miss trouble when they rely on averages instead of p95 or p99 latency, and a single bad dependency can trigger a chain of retries across many services. I also need to watch for cases where an API says “success” with a 200 OK but the payload still contains an error like “File Not Found.” That kind of mismatch can quietly break workflows.
In short, I use API monitoring to keep interfaces steady as traffic grows, cut mean time to detect issues, and reduce user-facing failures.
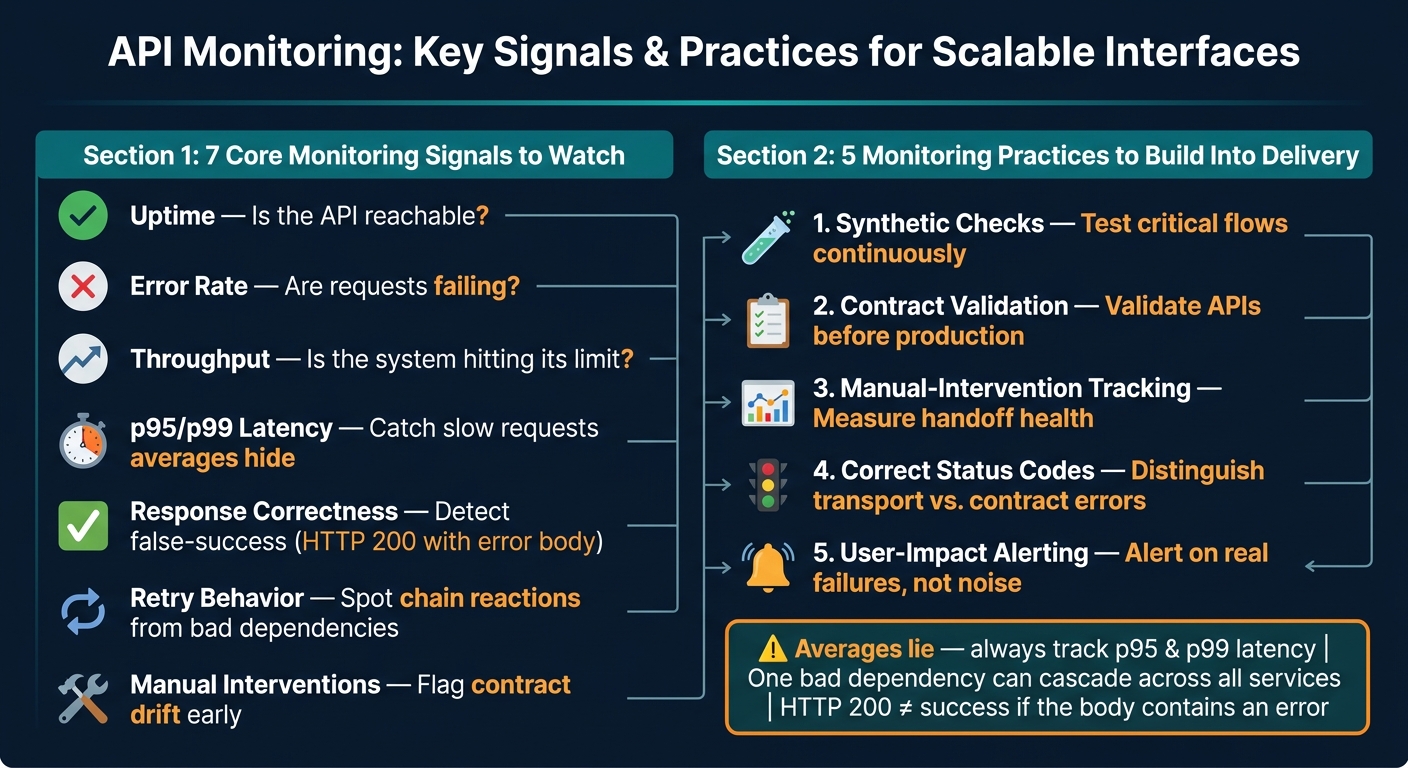
API Monitoring: Key Signals & Practices for Scalable Interfaces
Scaling Problems That API Monitoring Makes Visible
The first signs of scaling trouble usually show up in latency, dependency failures, and blurry ownership during incidents.
Latency spikes hidden by average response times
Average response time can paint a calm picture while users are having a much rougher ride. At scale, averages often bury the slowest requests inside one neat-looking number. That’s why it helps to track latency percentiles and service handoff time. Those metrics show where requests start dragging and where delays stack up. Without that view, slow downstream calls can sit in the dark until more users start feeling the slowdown.
How one failing dependency breaks multiple services
One weak dependency almost never fails alone. When a backend service starts timing out, upstream services often respond by retrying requests. If those retries happen without exponential backoff and jitter, they can keep hammering a service that’s trying to recover and push the problem into other parts of the system.
Tools like circuit breakers, strict timeouts, and clear fallbacks help contain the damage before it spreads. Monitoring timeout patterns and retry behavior gives teams a direct way to spot the chain reaction early and step in before it turns into a bigger outage. That’s why dependency monitoring matters.
Unclear ownership during incidents
When observability is weak, incidents can stall fast. Teams end up arguing over where the problem started instead of fixing it. Monitoring makes handoffs measurable by tracking errors, latency percentiles, and manual handoffs at each step in a workflow. That makes it much easier to see which service - and which team - needs to act.
This gets even more important when APIs send misleading signals, like an HTTP 200 OK wrapped around a "File Not Found" error. In cases like that, the source of the incident can be almost impossible to pin down without proper error tracking. Clear signals help the right team respond sooner.
sbb-itb-124fdbf
The Monitoring Signals That Show API Health at Scale
After you know where scaling starts to crack, the next job is watching the signals that show trouble early. At scale, only a small set of metrics does most of the work.
Uptime, error rate, and throughput
Uptime, error rate, and throughput are the core signals. They tell you if the API is reachable, if requests are failing, or if the system is hitting its limit.
Latency percentiles instead of averages
Use p95 and p99 instead of averages. They show the slow requests that averages tend to smooth over. Watching these percentiles helps teams spot delays that hurt user-facing speed.
But speed by itself doesn't tell the whole story. The response also has to be right.
Response correctness and contract health
One common silent failure is a false success, where an API returns HTTP 200 OK but the response body still contains an error message.
Monitoring response correctness and manual intervention helps teams catch these issues before they spread. A rising manual-intervention rate can point to contract drift even when error rates stay low. Tracking contract health protects trust in the interface, not just backend reliability.
Logs, Tracing, and Alerts That Cut Detection and Repair Time
Knowing an API is failing isn't enough. Teams need to figure out where it broke and why fast enough to fix it before users notice. Once monitoring flags an issue, logs and traces help track down the source.
Using logs, metrics, and tracing together
Each signal does a different job.
- Metrics show that something changed, like a spike in errors or latency.
- Logs show what failed and often why, including syntax errors or
"File Not Found"messages that a plain HTTP status code can miss. - Traces show the full request path, so teams can see where a call slowed down or failed across services.
Used together, they cut detection and repair time. Metrics point to the problem. Logs add detail. Traces connect the dots across systems.
This combo also helps teams catch issues that metrics alone may miss. For example, logs can surface response-body errors even when the API returns a successful status code, which closes an important blind spot.
That same mix of signals also makes alerts much more precise.
Alerting that catches real incidents without alert fatigue
As systems grow, alerting has to stay focused on failures that affect users instead of firing on every small blip. Alert thresholds should filter out short-lived noise and surface only sustained, user-impacting failures.
What Good Monitoring Enables as Systems Scale
Built into delivery, monitoring shifts from reactive to proactive.
Monitoring practices to build into delivery workflows
Once logs and alerts point to a problem, the next move is to make monitoring part of how teams ship changes. That’s where it starts to pay off in day-to-day work. Teams spot failures earlier, recover faster, and avoid the same incident showing up again a week later.
Monitoring does its best work when it’s part of the delivery process itself. Run synthetic checks on critical flows. Validate API contracts before changes reach production. Track manual interventions at each handoff. Use the right status codes so alerts can tell the difference between transport errors and contract failures. Also track when retries, timeouts, circuit breakers, and fallbacks kick in. And before deprecating APIs, track API version adoption so you know who’s still relying on older versions.
These practices do the most to stop user-facing breakage as systems grow:
- Synthetic checks
- Contract validation
- Manual-intervention tracking
- Correct status codes
- Alerting based on actual user impact
Conclusion: Faster recovery, steadier performance, better UX
When monitoring is built into delivery, the same failures are less likely to come back. The result is steadier performance, faster recovery, and a better user experience.
FAQs
Why do p95 and p99 matter more than average latency?
Average latency can blur what users actually feel. It smooths out spikes, so you get a broad sense of performance - but not the whole story.
That’s where p95 and p99 help. They show how long the slowest 5% and 1% of requests take. In plain English, they shine a light on the rough edges that averages tend to hide.
Those percentiles make it much easier to spot:
- instability
- capacity bottlenecks
- delays that hit only part of your traffic
So instead of seeing one neat average, you get a sharper look at reliability for the users stuck waiting the longest.
How can a 200 OK response still break the user experience?
A 200 OK response can still break the user experience when the payload hides errors or gives the wrong picture of the system state.
The request may succeed at the transport level, but the application can still send back a success status with content like "File Not Found" or syntax errors. That buries the actual issue, makes debugging more difficult, and can stop work in its tracks.
Which API monitoring signals should I track first?
Start with four core signals: latency percentiles like p95 and p99, error rates split by class (4xx vs. 5xx), total retry counts, and circuit breaker state changes for each dependency.
These are the main signs of API health. If retries go above 5% of total requests for a single provider, that usually points to broader degradation, not just a one-off issue.