
Ultimate Guide to Email-Based Customer Surveys
Event-triggered email surveys—1–5 neutral questions after purchases or support—boost responses and feed feedback into CRM for action.

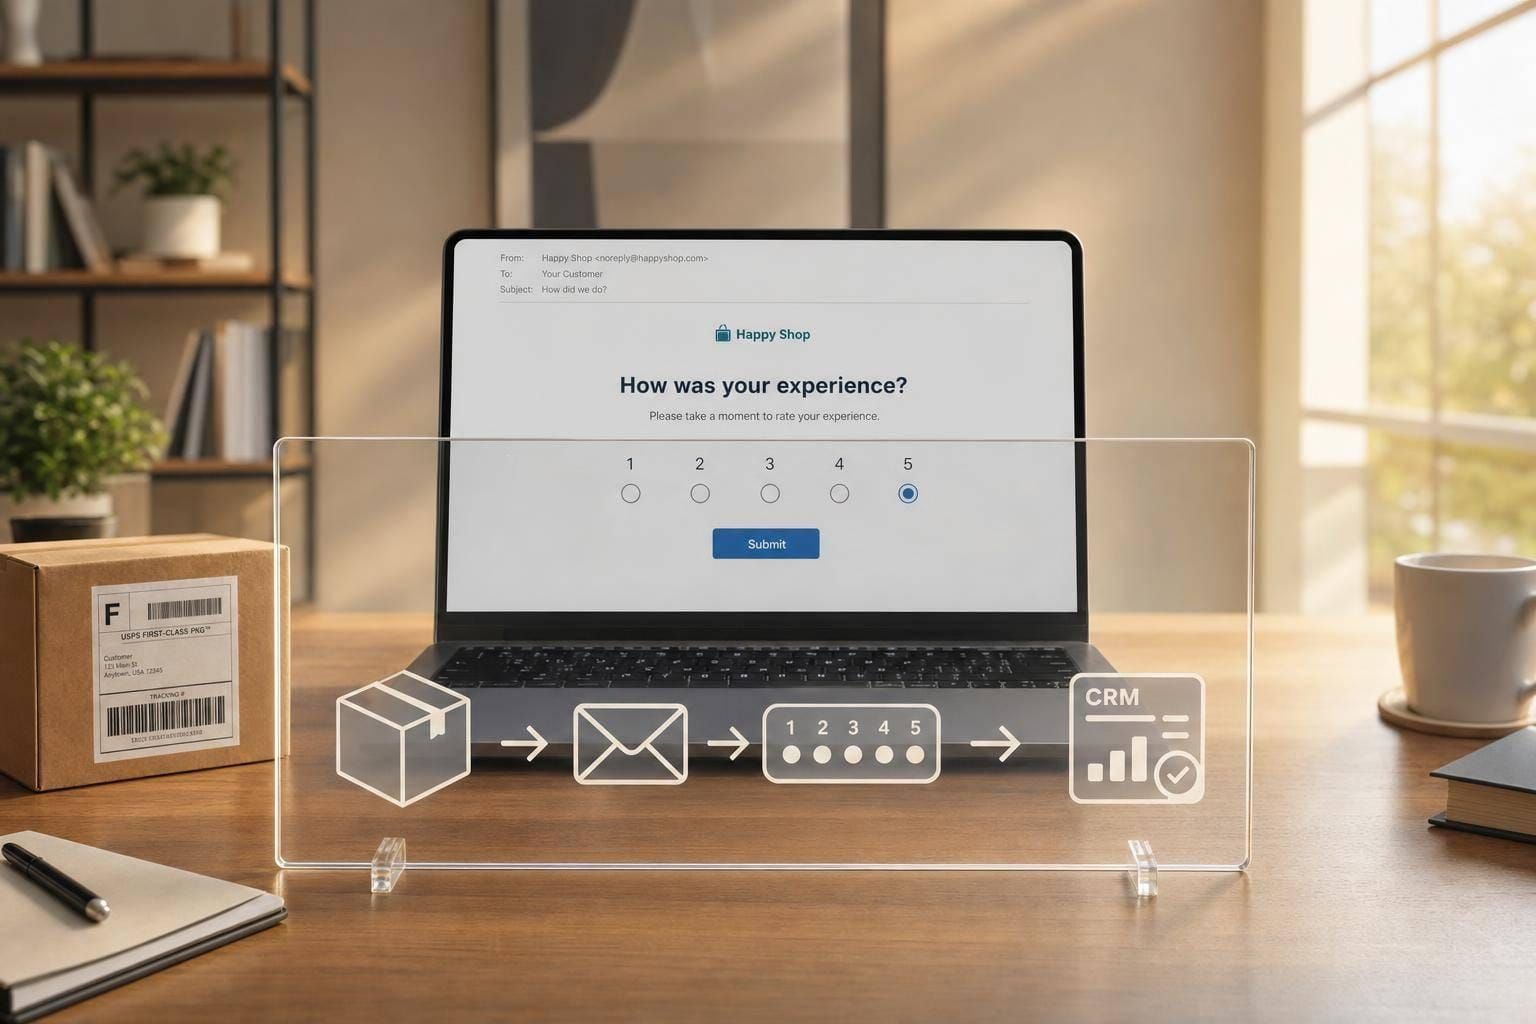
Most email surveys fail for simple reasons: they’re too long, sent to the wrong people, or show up at the wrong time.
If I had to sum up the whole topic in a few lines, it would be this:
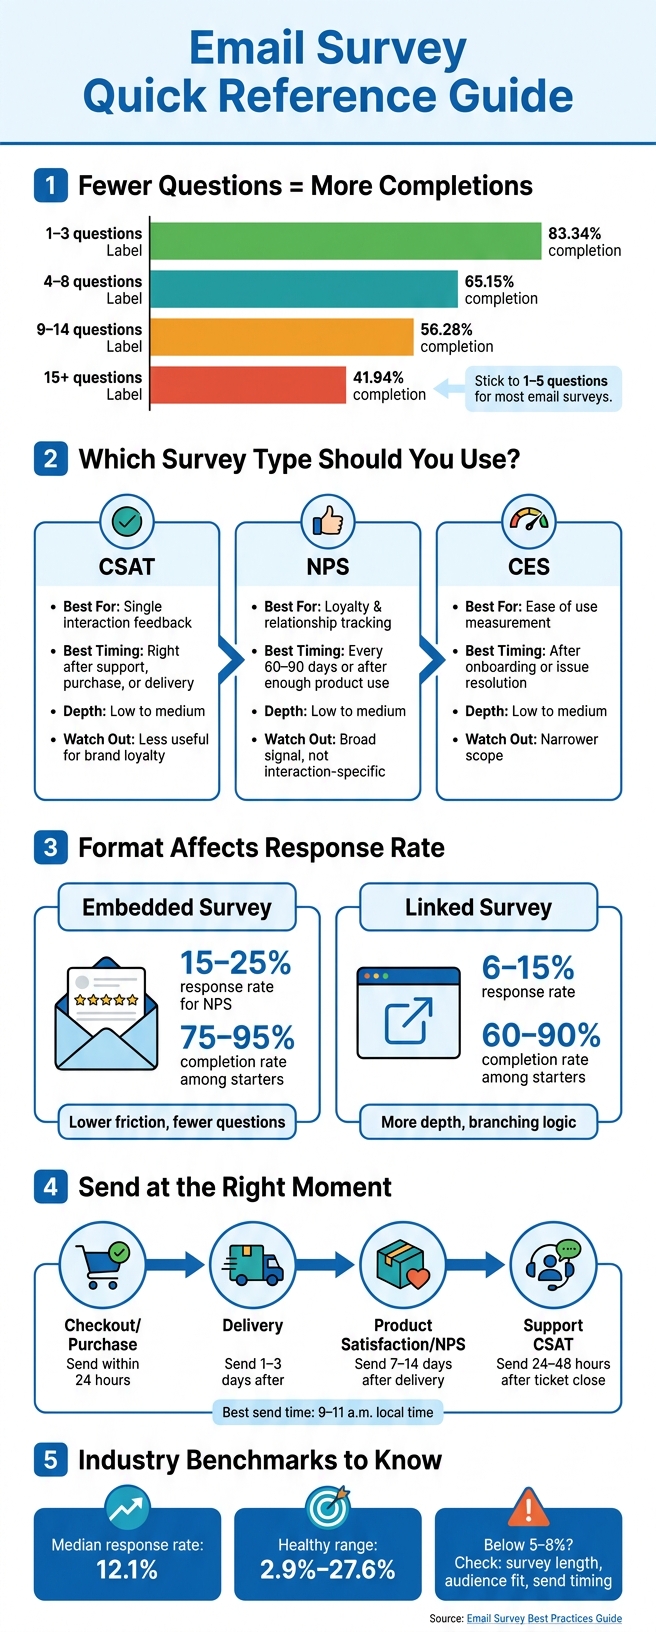
- Keep surveys short: 1–3 questions can hit an 83.34% completion rate
- Send based on a recent event, not a big batch calendar send
- Use CSAT for a single interaction, NPS for loyalty, and CES for ease
- Pick embedded surveys for low-friction replies and linked surveys for deeper feedback
- Track the full path: delivery, opens, clicks, starts, and completions
- Set privacy rules, opt-outs, and frequency caps before launch
- Route low scores into CRM, support, or product workflows so feedback leads to action
Here’s the short version: email surveys work best when you ask a small number of neutral questions, send them soon after a purchase, support case, onboarding step, or delivery, and tie replies to the systems your team already uses. Benchmarks help too: median response rate is about 12.1%, and anything under 5%–8% usually means you should check survey length, audience fit, or send timing first.
A few numbers stand out right away:
- 1–3 questions: 83.34% completion
- 4–8 questions: 65.15%
- 9–14 questions: 56.28%
- 15+ questions: 41.94%
- Embedded surveys often see 15%–25% response rates for NPS
- Linked versions often land around 6%–15%
Email Survey Types & Formats: Quick Comparison Guide
Quick Comparison
| Survey type / format | Best use | Best timing | Depth | Main tradeoff |
|---|---|---|---|---|
| CSAT | Single interaction | Right after support, purchase, or delivery | Low to medium | Good for moment-level feedback, less useful for brand loyalty |
| NPS | Loyalty and relationship tracking | Every 60–90 days or after enough product use | Low to medium | Simple to track, but broad |
| CES | Ease of use | After onboarding or issue resolution | Low to medium | Good for friction, narrower scope |
| Embedded survey | One-click feedback in email | Right after an event | Low | Less detail |
| Linked survey | Multi-question diagnosis | After an event when more detail is needed | Medium to high | One extra click can cut response |
In other words: if you want more replies, reduce effort. If you want more detail, accept a bit more drop-off. The rest comes down to clean targeting, clear wording, and using the data instead of letting it sit in a spreadsheet.
sbb-itb-124fdbf
Designing Survey Experiences That People Actually Complete
A survey only works if people finish it.
Set a Clear Objective, Audience Segment, and Question Limit
Once you’ve picked the survey type, the next job is simple: cut friction.
Before you write a single question, write one sentence that explains the decision this survey will shape. Skip broad goals like “understand customer satisfaction.” Go tighter, such as: “Determine whether new users find the onboarding flow confusing so the product team can prioritize fixes this quarter.” That sentence becomes your filter. If a question doesn’t help answer that decision, cut it.
Scope comes first. Then comes length.
An analysis of 267,564 survey responses found that surveys with 1–3 questions reach an 83.34% completion rate. That falls to 65.15% for 4–8 questions, 56.28% for 9–14, and 41.94% for surveys with 15 or more questions. For most email surveys, stick to 1–5 questions.
Who you send the survey to matters just as much as how long it is. Ask people who have a clear, recent experience to talk about. For example:
- A post-purchase satisfaction survey should go to customers who completed a transaction in the last 7–14 days
- Lifecycle surveys may target new sign-ups from the last 30 days or customers who upgraded in the past month
- Support surveys should trigger right after a support interaction closes
It also helps to set a documented per-user frequency cap. And if someone already got or completed another survey recently, leave them out.
Write Neutral, Accessible Questions People Can Answer Quickly
Two problems show up all the time in survey writing: leading language and double-barreled questions.
Leading language pushes people toward an answer. “How helpful was our excellent customer support team?” already plants an opinion in the respondent’s head. A neutral version is much better: “How helpful was the customer support you received?” paired with a clearly labeled 1–5 scale.
Double-barreled questions cram two ideas into one. “How satisfied are you with our pricing and product quality?” sounds neat, but it creates messy data. A person may like one and dislike the other. Split that into two questions, or drop the one that matters less.
On the design side, don’t make people work harder than they need to. Use 14–16px type on mobile, 44×44px touch targets, single-column layouts, and WCAG AA contrast.
Open-text questions need restraint. They can surface pain points you didn’t see coming. “What was the most confusing part of the new dashboard?” is a good example. But they also ask more from the respondent. A solid rule is no more than one open-text question per short email survey. Put it at the end, after the structured questions. Make it optional. And tell people why their written feedback matters.
Handle Privacy, Consent, and Data Minimization From the Start
Next, strip out any data collection that doesn’t serve the goal.
Tell respondents, in plain language, why you’re asking for feedback, what you collect, how long you keep it, and how they can access or delete it. A short paragraph near the call-to-action is enough. Regulatory guidance backs this up: a clear privacy notice can be delivered in about five sentences covering who runs the survey, what the data is used for, what’s collected, that participation is voluntary, and how to withdraw. Include a clear unsubscribe link in the email.
Data minimization means collecting only the information you plan to use. If you only need trend data at the group level, don’t tie responses to individual user profiles. If you won’t review device type, don’t collect it. Match every data field to a documented purpose, and remove anything without a clear use case.
That does two things at once: it keeps the data cleaner and lowers compliance risk. It also shows respondents that you’re not asking for information just because it’s there for the taking.
Building and Sending Survey Emails
Once the survey questions are set, the email itself often makes the difference between a response and silence. A well-built survey means very little if the email never gets opened or clicked. The subject line, body copy, format, and send timing all shape response.
Structure the Email for Clarity and Fast Action
Get four things across right away: who’s asking, why now, how long it takes, and what the reader should do next. If someone has to dig for any of that, you’ve probably lost them.
Keep the subject line to about 50 characters and connect it to a real interaction. A subject like Quick 2-minute feedback on your recent order works because it’s specific and direct. Skip vague wording, and avoid spam signals like ALL CAPS, dollar signs, or too many exclamation points. Use the preheader to support the subject line, not repeat it. For example: Your answers help us improve future support. Takes 3 minutes.
In the body, lead with the reason for the survey, mention the number of questions and time estimate, and use one clear CTA button. Then close with a short thank-you. Extra links, long blocks of text, and heavy branding can distract from the one thing you want the reader to do.
For layout, keep it simple:
- Use a single-column design
- Make tap targets at least 44×44 px
- Aim for about 65 characters per line
Choose Between Linked Surveys and Embedded Questions
Pick the format that gets the data you need with the fewest steps. That’s the tradeoff: less friction versus more depth.
Embedded surveys place the first question right inside the email. Usually that means a one-click rating, a yes/no prompt, or a simple sentiment scale. Since people can respond without leaving the inbox, participation is often higher. Research published in Survey Practice found that embedding a survey question in the invitation email improved both click rate and completion rate compared with a standard link-only invite. Response rates for embedded NPS surveys are often cited in the 15–25% range, versus 6–15% for linked versions.
Linked surveys take the reader to a separate landing page. Yes, that adds a click. But it also gives you branching logic, more question types, and better analytics. Use linked surveys when you need follow-up questions, branching paths, or deeper diagnosis.
| Format | Question count | Effort | Analytics quality | Best-fit scenarios |
|---|---|---|---|---|
| Linked survey | Medium to high | Higher | Stronger | Product feedback, post-support surveys, onboarding diagnostics |
| Embedded survey | One or very few | Lower | More limited | CSAT pulse checks, simple sentiment capture, quick event-based feedback |
Use the lowest-friction option that still gets the job done. If one rating tells you what you need to know, there’s no reason to send someone to a landing page.
Use Event-Based Triggers, Send Timing, and Frequency Caps
Surveys sent right after a meaningful moment tend to do better than generic scheduled blasts. Why? Because the experience is still fresh in the customer’s mind. Good trigger points include order delivery, support ticket resolution, onboarding milestones, feature adoption milestones, and subscription renewals.
Timing inside those trigger windows matters too:
- Checkout or purchase experience: send right away or within 24 hours.
- Delivery experience: send 1 to 3 days after delivery.
- Product satisfaction or NPS: send 7 to 14 days after delivery or 1 to 4 weeks after first use.
- Support CSAT: send 24 to 48 hours after ticket resolution.
For time of day, send at 9–11 a.m. local time. In the U.S., that matters a lot because multiple time zones can turn one scheduled send into an early-morning annoyance or a late-night email that gets buried.
Cap NPS and broader satisfaction surveys at one send every 60 to 90 days. Also suppress follow-ups unless the experience is clearly different.
These delivery rules help you collect cleaner data for the tools and workflows that come next.
Tools, Integrations, and Workflow Setup
Once your survey is live, the next step is simple in theory but messy in practice: getting responses into the tools your team already relies on.
What to Look for in Email Survey Tools
Pick the tool that fits how your team works and where your data lives.
Start with the basics. Make sure the tool supports both short surveys and multi-step surveys. Then check the sending controls: bounce tracking, suppression lists, and authenticated sending all matter. On the reporting side, look for real-time dashboards, response views you can filter, and export options in CSV or spreadsheet-friendly formats so the data can flow into BI tools or a data warehouse.
You’ll also want API access and native integrations with the CRM, support desk, and product analytics tools your team already uses. If a survey platform can’t connect with your stack, people end up doing cleanup by hand. That usually means slow follow-up, messy reporting, and data stuck in separate places.
Of course, those features only help if responses can be tied back to customer records and sent to the right place without manual fixes.
Connect Surveys to CRM, Product, and Support Data
Survey responses only matter when they show up in the systems that drive action.
Each response should include enough metadata to make sense in context. At a minimum, that means customer ID, account ID, plan type, survey trigger, event date, and campaign ID. With that data in place, analysts can compare satisfaction across new customers and long-term customers, or across users on different pricing tiers. Without that context, a score is just a number.
Before launch, set your routing rules. Low scores and tagged complaints should move into the right systems on their own. In most cases, automated workflows work best when they use a mix of:
- Score thresholds
- Predefined tags
- Customer attributes
That setup helps the right person see the right signal without manual triage.
Use stable IDs, and keep raw responses separate from derived fields like sentiment tags or escalation flags. That way, the original answers stay untouched if your team needs to review them again later.
Apply UX Education to Survey Systems With DeveloperUX
The internal dashboard matters too. Teams need to read results fast and know what to do next.
DeveloperUX shares UX basics that can help teams build clearer survey dashboards and feedback systems that are easier to scan and use.
Measuring Results and Improving Survey Performance
Track the Metrics That Show Email and Survey Health
Once responses start coming in, measure the full path from email to finished survey. Think of it like a funnel: delivery, open, click, start, and completion. That view makes it much easier to spot where people fall off.
Use the same formulas every time for delivery rate, open rate, CTR, completion rate, and drop-off rate. Consistent math matters. It helps you tell the difference between an email problem, like poor deliverability, and a survey problem, like weak question flow or too much friction.
Beyond funnel metrics, three scores help turn response data into business signals. CSAT is often calculated as satisfied responses ÷ total responses × 100%. So if 380 out of 500 respondents pick 4 or 5 on a 5-point scale, CSAT is 76%. NPS sorts respondents into promoters (9–10), passives (7–8), and detractors (0–6), then calculates % promoters − % detractors. CES can be reported either as the average effort score or as the share of low-effort responses.
A single top-line score can hide a lot. Segment these scores by journey or event trigger, such as post-purchase, onboarding, or ticket closed, instead of leaning on one overall number. Then pair each score with the top 3–5 recurring comment themes so you can see what needs attention in plain English.
Benchmark Response Rates by Format and Survey Type
Response rates tend to shift most based on format and audience quality. Across a large dataset of survey programs, the overall median response rate is about 12.1%, and the middle 50% falls between 2.9% and 27.6%.
Use those numbers as a reference point, not a fixed goal.
| Survey Format | Typical Response Rate Range | Completion Rate (Among Starters) | Key Factors |
|---|---|---|---|
| Embedded | 15–40% | 75–95% | Recent event relevance, one-tap answers, mobile UX |
| Linked | 10–30% | 60–90% | Page load speed, survey length, clear incentive |
Who you send to can matter as much as the survey itself. Recently active and engaged users usually respond at much higher rates than a full-list send. That’s why it helps to build your own baseline over 3–6 months by tracking results by survey type and trigger, then checking targets every quarter.
If response rates stay stuck below 5–8%, start with the basics: survey length, relevance, and send timing.
Use a Continuous Improvement Loop for Better Data
Once you know where people drop off, change ONE thing at a time. Test subject line styles, send times, sender names, and email layouts with controlled A/B tests. A good working range is 1,000–2,000 recipients per variant, with tests running for 48–72 hours so you capture most opens and clicks.
It’s easy to stop at open rate, but that can send you in the wrong direction. Follow each test through to completion rate and CSAT or NPS so you know whether the change improved the data itself, not just top-level engagement.
Keep a simple log for each experiment:
- the hypothesis
- the result
- the next step
That running record helps each round of testing sharpen the questions, timing, and signals you get back.
Conclusion: Core Practices That Make Email Surveys Work
Email surveys work best when teams stay disciplined. The basics are simple: pick the survey type that fits the business question, keep it short enough to finish fast, and send it while the experience is still fresh. In most cases, that means within 24 hours of a purchase, support resolution, or onboarding milestone.
Be clear about why you're asking, how the data will be used, and how people can opt out. That kind of trust makes the responses more useful. And when you close the loop by showing how feedback led to product or service changes, future participation can go up by 4–6 percentage points.
Automation is where survey data starts doing actual work. When NPS and CSAT scores flow straight into CRM records and trigger follow-up tasks for customer success teams, feedback stops sitting in a dashboard and starts shaping day-to-day workflows. For teams building those internal tools and dashboards, DeveloperUX offers UX education for clearer, lower-friction survey systems. Once those connections are in place, launch checks get much easier.
Before launch, make sure you:
- Match the survey type to the decision
- Keep it to 1–5 questions
- Use neutral, jargon-free wording
- Set timing and frequency caps
- Confirm integrations
The strongest programs get better one survey at a time. Treat email surveys as an ongoing system, not a one-off campaign. Small gains in timing, question design, and follow-through add up.
FAQs
How do I choose between CSAT, NPS, and CES?
Choose between CSAT, NPS, and CES based on what you want to measure. Each one looks at a different part of performance across user experiences and regions.
Pick the metric that fits your goal. For example, use one to gauge how well users are served, or another to see how easily they complete a task. The key is to match the metric to your business goals and the customer interactions you want to improve.
When should I send an email survey after a customer action?
Send the survey right after the customer takes action, while the experience is still fresh. That timing helps you collect feedback that is more accurate, more useful, and easier to act on.
When you reach out while the interaction is still top of mind, people can recall details more easily. That gives you a clearer read on user sentiment, helps you spot friction points, and makes it easier to close the loop.
What should I do if my survey response rate is low?
Review response patterns and completion rates to spot where people drop off. If a survey takes more than 7 to 8 minutes, completion rates can fall by 5% to 25%. That’s a pretty steep dip, so short, engaging surveys usually work better.
It also helps to spread surveys across multiple channels instead of relying on just one. That gives you a better mix of responses. At the same time, check for bias and document your methodology so others can understand how the data was gathered and read.
Surveys shouldn’t be your only source of feedback, either. You can also use:
- Listening sessions
- A/B testing
- Other feedback methods that show what people say and what they do