
UX Analytics for Enterprise Dashboards
Set decisions, shared metrics, and data rules to build role-based enterprise UX dashboards teams can act on.

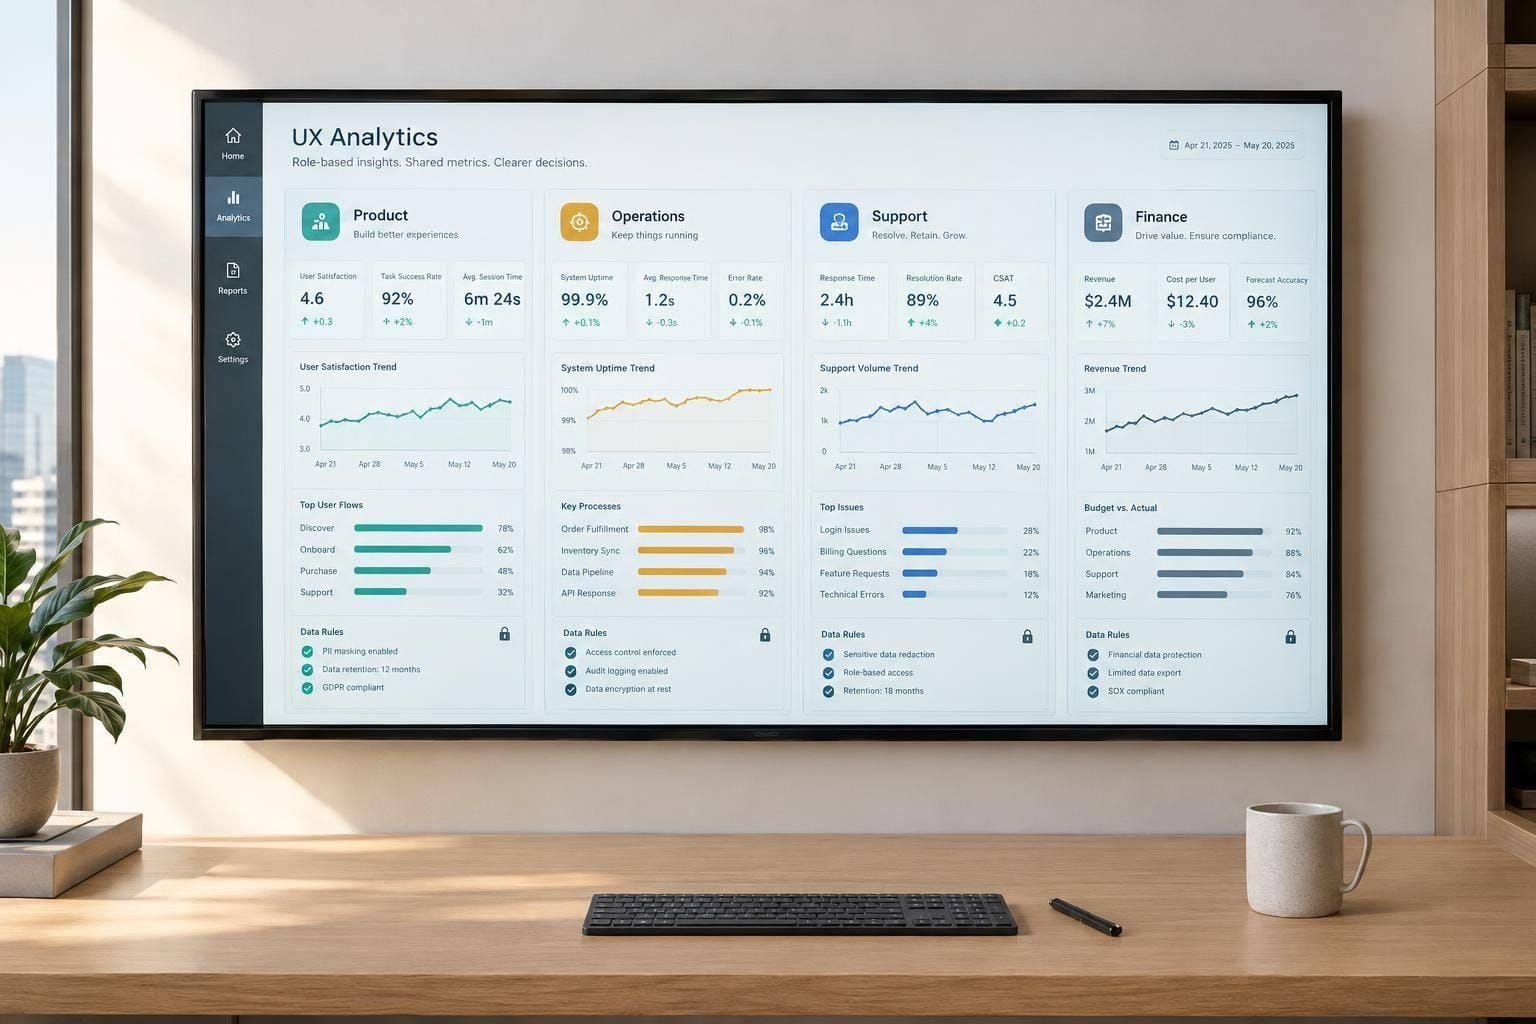
I start UX dashboards with a decision - not a chart. Before choosing metrics, I define whose tasks we’re measuring, what success means, and who will act when results miss the target.
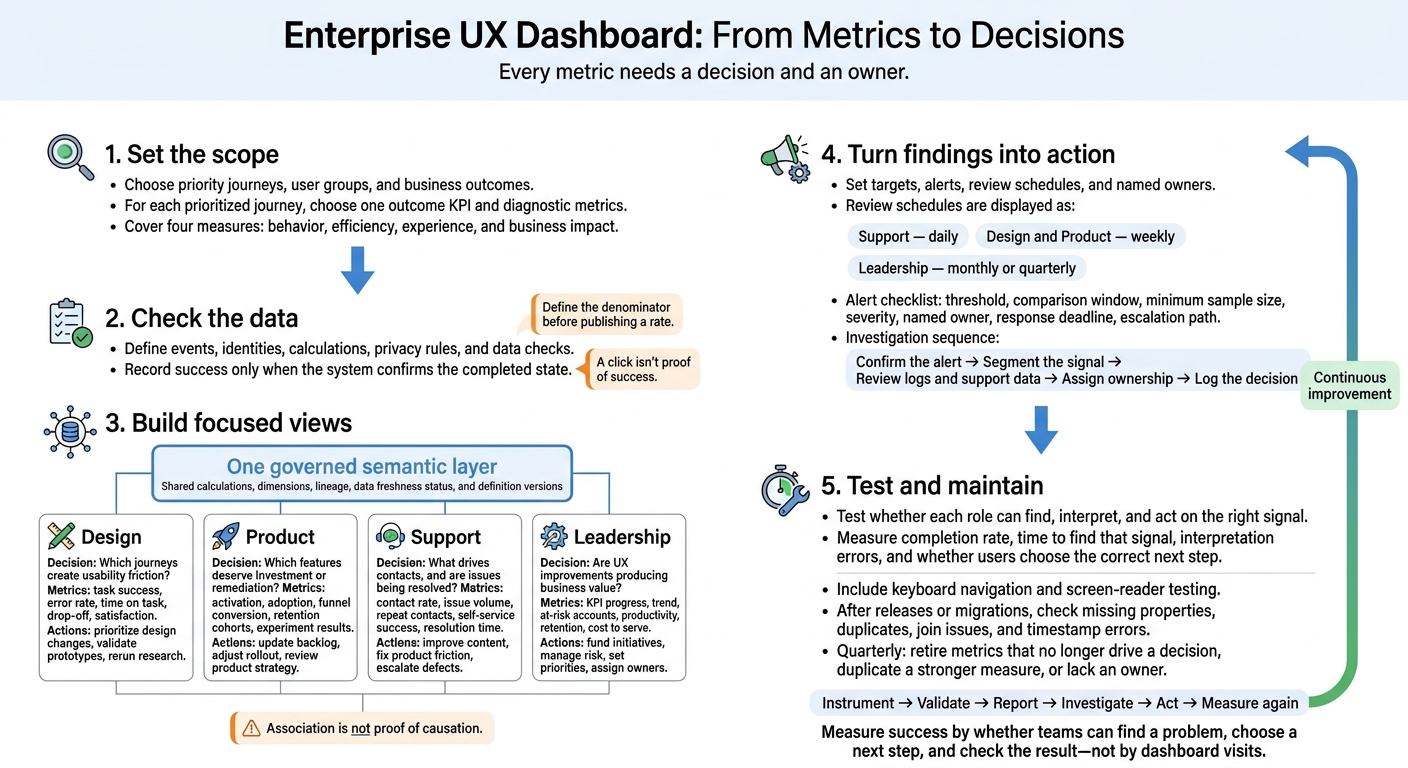
My approach connects 4 teams - Design, Product, Support, and leadership - through shared metric definitions, while giving each team a view built for its decisions:
- Set the scope: Choose priority journeys, user groups, and business outcomes.
- Check the data: Define events, identities, calculations, privacy rules, and data checks.
- Build focused views: Connect task success, adoption, support contacts, and business results without treating correlation as proof of cause.
- Turn findings into action: Set targets, alerts, review schedules, and named owners.
- Test and maintain: Check accessibility, whether people can use the dashboard, and whether its numbers remain correct.
My rule: <u>every metric needs a decision and an owner</u>. I measure success by whether teams can find a problem, choose a next step, and check the result - not by dashboard visits.
Enterprise UX Dashboard: From Metrics to Decisions
Choose UX Metrics and Set Data Rules
Link UX Metrics to Tasks and Business Outcomes
For each prioritized journey, choose one outcome KPI and the diagnostic metrics that help explain it. Map each critical task to four measures: behavior, efficiency, experience, and business impact. Keep the set small, but cover the task from start to finish.
| Metric | Purpose and formula | Source | Owner | Segment | Update |
|---|---|---|---|---|---|
| Adoption | Meaningful use: eligible users with qualifying use ÷ eligible users | Product events and entitlement data | Product | Role, plan, region, device | Daily |
| Completion | Completed eligible attempts ÷ started eligible attempts | Product event stream | Product analytics | Role, plan, device | Daily |
| Time to completion | Median time from task start to confirmed completion | Timestamped task events | UX research or analytics | Role, experience level, device | Daily |
| Error rate | Error events ÷ relevant task attempts | Application logs and analytics | Engineering | Workflow step, error code, release | Hourly |
| Satisfaction | Average post-task rating, with response count | In-product survey | Research | Task, role, account tier | Weekly |
| Retention | Active accounts in the follow-up window ÷ eligible baseline accounts | Product and customer systems | Customer success | Cohort, plan, industry | Monthly |
| Productivity | Completed tasks per labor hour | Operations records | Operations | Team, task | Monthly |
| Cost to serve | Attributable support cost per completed task | Support and finance records | Finance or operations | Channel, segment | Monthly |
Define the denominator before publishing a rate. Spell out eligibility, retries, timeouts, and the measurement window. For retention, include cohort start dates and rules for churn, upgrades, and role changes.
Use a fixed survey scale and report response counts. Show the numerator and denominator alongside each percentage, set minimum sample thresholds, and suppress or combine very small segments.
Define Events, User Identity, and Data Controls
Once you’ve chosen the metrics, define the events and identities behind them.
Build an event dictionary with stable names: task_started, task_step_completed, validation_error_shown, task_submitted, task_completed, and task_abandoned. For each event, document its trigger, required properties, allowed values, owner, and version.
Include event_id, event_timestamp, task_id, workflow_version, account_id, privacy-safe user_id, role, device_type, platform, app_version, experiment_id, and error_code.
A click isn’t proof of success. Record success only when the system confirms the completed state. Define session timeouts, how to handle background tabs, and whether task time includes pauses. Track mandatory workflows separately from voluntary use.
Keep person, session, device, account, workspace, and organization identifiers separate. Never mix user-level adoption with account-level renewal denominators. Link cross-device activity through approved authenticated IDs, and set clear rules for anonymous activity and account transfers.
Assign owners for access, privacy, retention, deletion, schema changes, and data quality. Collect as little personal data as possible and restrict event-level access. Continuously check for missing fields, duplicate IDs, late events, and out-of-order or impossible sequences. These rules let teams compare dashboard trends across time and systems.
Connect Data Sources to Shared Metric Definitions
Load validated sources into one governed semantic layer. This layer should hold shared calculations, dimensions, lineage, data freshness status, and definition versions, so every dashboard calculates each metric the same way.
Join data through stable account, task, and experiment IDs - not display names. Check that joins don’t multiply records, and reconcile completions against authoritative transactions before approval.
Match update timing to the decision: immediate signals for incidents, daily updates for operations, and periodic reports for retention and financial outcomes. Use the strongest source for each decision, then resolve conflicts through the semantic layer.
| Source | Best use | Update frequency | Ownership | Main limits |
|---|---|---|---|---|
| Product analytics | Broad behavioral and funnel coverage | Hourly or daily | Product analytics | Instrumentation gaps and sampled or blocked events |
| Application and server logs | Authoritative transactions and errors | Near real time | Engineering | Limited perception and context |
| Surveys | Satisfaction, effort, and verbatim feedback | Weekly or periodic | UX research | Response bias and small samples |
| Support or CRM records | Contact reasons, resolution, and customer impact | Hourly or daily | Support operations | Inconsistent tagging and duplicate cases |
| Experiment platform | Treatment exposure and outcome comparison | Daily or experiment-based | Experimentation team | Requires valid assignment and sufficient sample |
| Finance and business systems | Revenue, renewals, productivity, and cost | Daily, monthly, or quarterly | Finance or operations | Delayed updates and attribution limits |
sbb-itb-124fdbf
Build Views for Design, Product, Support, and Leadership
Use the shared metric layer to turn one dashboard into views built around each team’s decisions. Keep primary screens focused on metrics teams can act on. Put research findings, event traces, tickets, and affected accounts in drill-downs.
Keep date, product, segment, device, geography, and account-tier filters in place when users switch views. Protect sensitive records with row- and field-level access controls. Every view should show the same metrics, just at a different level of detail.
| Team | Decisions | Primary metrics | Evidence | Actions |
|---|---|---|---|---|
| Design | Which journeys create usability friction? | Task success, error rate, time on task, drop-off, satisfaction | Usability studies, accessibility findings, feedback themes, session evidence | Prioritize design changes, validate prototypes, rerun research |
| Product | Which features deserve investment or remediation? | Activation, adoption, funnel conversion, retention cohorts, experiment results | Release history, feature usage, account segments, experiment analysis | Update backlog, adjust rollout, review product strategy |
| Support | What drives contacts, and are issues being resolved? | Contact rate, issue volume, repeat contacts, self-service success, resolution time | Ticket categories, journey mapping, help-center search, release correlations | Improve content, fix product friction, escalate defects |
| Leadership | Are UX improvements producing business value? | KPI progress, trend, at-risk accounts, productivity, retention, cost to serve | Target comparisons, cohort trends, opportunity ranking, causal analysis | Fund initiatives, manage risk, set priorities, assign owners |
Design and Product: Track Friction, Adoption, and Retention
Give Design drill-downs into failed steps, usability findings, and feedback themes so the team can decide which friction to address. For Product, show funnels, activation milestones, retention cohorts, and experiment outcomes alongside release annotations.
Required use can mask poor usability. Contracts or company policy can keep adoption steady even when users struggle to complete tasks. Pair usage data with task success and research before setting priorities.
Link each proposed change to its baseline, affected segment, evidence, and success threshold. During release reviews, compare equivalent populations and annotate deployments, policy changes, and instrumentation changes. Design validates usability; Product sets priorities and decides how to roll out changes.
Support: Track Contact Drivers and Resolution
Show both counts and rates. Connect issue categories to journeys, error codes, and releases through drill-downs. These links help Support separate documentation gaps from defects, permissions problems, and training needs.
Fewer tickets do not prove resolution. Before marking an issue resolved, review self-service success alongside task completion or explicit resolution confirmation. Also check related searches or tickets within the follow-up window, repeat contacts, and resolution time.
Leadership: Track UX Outcomes and Business Impact
Tie executive views to the same task and cohort metrics teams use. Help leaders decide which initiatives to fund and which risks to address. Limit the primary screen to KPI status, target progress, trends, at-risk accounts, and ranked opportunities.
Use drill-downs to connect each opportunity to productivity, retention, or cost to serve, with an owner and a next decision. Rank opportunities by impact, affected users, severity, confidence, and effort - not volume alone.
Label observational results “associated with” rather than “caused by”; stronger claims need a controlled experiment or sound causal analysis.
With shared metric definitions in place, use them to build role-based views and set rules for how teams act on the data.
Design, Test, and Maintain the Dashboard
Organize Alerts, KPIs, Trends, and Details
Start each view with the decision it supports. Show only the signals needed to act, in this order: alerts, KPIs against targets, trends, segment comparisons, and drill-downs. Use line charts for trends, bars for categories, funnels for task flow, and tables for exact values. Include the metric name, definition link, comparison period, update time, time zone, and release annotation.
Make charts accessible with labels, keyboard focus, a logical tab order, and table alternatives. Use sufficient contrast, consistent U.S. number and date formats, and explicit time zones.
Assign Review Schedules, Alert Rules, and Owners
Schedule daily reviews for Support, weekly reviews for Design and Product, and monthly or quarterly reviews for leadership. Every alert needs a threshold, comparison window, minimum sample size, severity, named owner, response deadline, and escalation path. When different people own the metric, data, and decision, make those roles clear. Log each decision with its owner, due date, release ID, and follow-up metric.
Use the same investigation workflow each time: confirm the alert, segment the signal, review logs and support data, assign ownership, and log the decision.
Test Dashboard Use and Check Data Quality
After launch, check whether each role can find, interpret, and act on the right signal. Measure completion rate, time to find that signal, interpretation errors, and whether users choose the correct next step. Visits alone won't tell you whether the dashboard works. Include keyboard navigation and screen-reader testing.
After releases or migrations, check for missing properties, duplicates, join issues, and timestamp errors. Reconcile old and new totals during an agreed overlap period, and mark invalid metrics before teams act on them. During quarterly reviews, retire metrics that no longer drive a decision, duplicate a stronger measure, or lack an owner.
Conclusion: Guide Team Decisions With Shared Metrics
A dashboard works when it helps teams make decisions - not just display data. Start with the decision, then use one shared metric standard across audiences, segments, review windows, and privacy rules. The goal is faster, better decisions, not consistency for its own sake.
Use that shared standard to support multiple views. Different teams can use the same metric to make different decisions without changing what it means.
Close the loop: instrument, validate, report, investigate, act, and measure again. Assign named owners to follow-up actions, and measure improvement against a baseline.
FAQs
How do I set UX targets without historical data?
Establish a baseline before making changes. Use industry benchmarks, measure current performance, and document your measurement methods. Work with stakeholders to connect UX targets to business goals. Make each target specific, measurable, achievable, relevant, and time-bound.
If you don’t have past quantitative trends, use interviews and usability testing to pinpoint pain points and understand the reasons behind them. That context helps you set realistic targets your team can act on.
How can I measure UX for low-volume workflows?
When quantitative data is limited, qualitative research can help explain why users behave the way they do. Use one-on-one interviews and usability testing to watch users complete tasks, spot pain points, and collect detailed feedback. Ask users to think aloud, and pay attention to nonverbal cues.
Then use surveys to check those findings across a larger group. This helps you build a more rounded picture of the user experience, even when transaction counts are low.
How do I prioritize conflicting signals across teams?
Document trade-offs and let evidence - not team influence - guide priorities. Check patterns by pairing qualitative feedback with drop-off rates, error frequencies, and ticket volumes. Treat complaints without supporting data as outliers. Use Impact-Effort, RICE, or MoSCoW to rank issues based on user impact, business goals, and technical feasibility.
When uncertainty remains, spell out what’s unknown. Run research or a controlled test instead of forcing a decision, and assign clear ownership at every step.